
This is Part 1 of a blog series about using Zabbix with Data Diodes.
Background
Disclaimer: I’m not claiming that this solution is perfect, nor do I recommend using these methods in a production environment without some thorough consideration. I find this topic interesting, and thus perhaps someone will find these methods an inspiration for future studies.
So what is this blog post about, and why might you find it interesting? Well like me, you’ve probably heard about data diodes and how to restrict traffic one way. As defined by Jones, D & Bowersox, T. 2006. Secure data export and auditing using data diodes [Source URL], it’s defined as following;
Data diodes, that is, devices which permit only one-way communication, without even a reverse channel for acknowledgment
This method of communication gives us unique challenges, and thus we get to use some unusual ways for transferring data. This blog post will not go into how to make sure that we have received the messages, or even if they contain errors. For the sake of argument, we’re going to assume that there are no disturbances in the transmitted packages from one site to another.
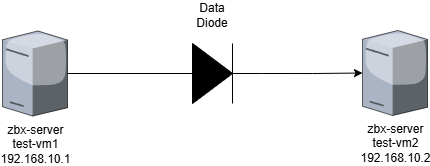
Where do you use data diodes? Well you can use them to separate a high security environment from a lower security environment, while still maintaining one way communication. More about applications and design considerations can be read in Finnish for example at Ohje yhdyskäytäväratkaisujen suunnitteluperiaatteista ja ratkaisumalleista | Kyberturvallisuuskeskus.
DYI Data Diode
Data diodes are really specialized equipment you can’t really find in eBay. You could make things using firewalls to block traffic, but where’s the fun in that? I followed wavestone-cdt/dyode: A low-cost, DIY data diode for ICS guide on how to use media converters to create your own one-way diode.
Zabbix and TCP-protocol
The main difference between UDP and TCP is that UDP doesn’t care if you get the message or not. Most modern applications rely on TCP, as does Zabbix. All Zabbix components use TCP (Zabbix Proxy, Zabbix Sender, Zabbix Agent…) for communication and thus they can’t be used for metric streaming or alerting. You can read more about UDP and how it works on the following sites;

Here’s a short tcpdump of Zabbix Sender behind a data diode. Test-vm1 is sending data, while test-vm2 would be on the receiving end.
[root@test-vm1 ~]# zabbix_sender -vv -z 192.168.10.2 -s "test-vm1" -k test -o 1
zabbix_sender [2546]: DEBUG: In zbx_comms_exchange_with_redirect()
zabbix_sender [2546]: DEBUG: In zbx_connect_to_server() [192.168.10.2]:10051 [timeout:60, connection timeout:3]
zabbix_sender [2546]: DEBUG: In zbx_is_ip4() ip:'192.168.10.2'
zabbix_sender [2546]: DEBUG: End of zbx_is_ip4():SUCCEED
zabbix_sender [2546]: DEBUG: Unable to connect to [192.168.10.2]:10051 [cannot connect to [[192.168.10.2]:10051]: connection timed out]
zabbix_sender [2546]: DEBUG: End of zbx_connect_to_server():FAIL
zabbix_sender [2546]: DEBUG: unable to connect to [192.168.10.2]:10051: cannot connect to [[192.168.10.2]:10051]: connection timed out
zabbix_sender [2546]: DEBUG: End of zbx_comms_exchange_with_redirect():CONNECT_ERROR
Sending failed.
[root@test-vm2 ~]# tcpdump -v -i ens35
dropped privs to tcpdump
tcpdump: listening on ens35, link-type EN10MB (Ethernet), snapshot length 262144 bytes
12:24:46.514662 IP (tos 0x0, ttl 64, id 54249, offset 0, flags [DF], proto TCP (6), length 60)
192.168.10.1.49430 > test-vm2.zabbix-trapper: Flags [S], cksum 0x8eb3 (correct), seq 364713927, win 32120, options [mss 1460,sackOK,TS val 3554786496 ecr 0,nop,wscale 7], length 0
12:24:46.514766 ARP, Ethernet (len 6), IPv4 (len 4), Request who-has 192.168.10.1 tell test-vm2, length 28
12:24:47.554618 IP (tos 0x0, ttl 64, id 54250, offset 0, flags [DF], proto TCP (6), length 60)
192.168.10.1.49430 > test-vm2.zabbix-trapper: Flags [S], cksum 0x8aa3 (correct), seq 364713927, win 32120, options [mss 1460,sackOK,TS val 3554787536 ecr 0,nop,wscale 7], length 0As you can see, test-vm2 will receive the initial package but that’s it. Return packets go to oblivion. There’s no way to send data with Zabbix as of now. Perhaps Zabbix will add UDP as an optional protocol in a future version?
What about rsyslog?
Here’s a little background to the solution I went with. Log shipping is a standard method used to transmit text from one server to another. It’s usually enough to to send the data without consideration if the receiving end gets it or not. The same thing kind of applies to metric streaming. We usually don’t care if we get all metrics all the time. Obviously we can’t use any secure protocols as they require a TCP connection, so anything sent will be in clear text.
Rather than modifying the Zabbix source code to add UDP support, I decided to look at alternatives. Knowing that rsyslog can be configured with ease to ship data between servers in a streaming fashion, I decided to go that way for my initial attempt. What we need to do is configure one server to send it’s logs to a second server that will receive it. I’m oversimplifying things here, but here’s what you need to do in short;
Add the following to sending test-vm1 /etc/rsyslog.conf:
# rsyslog configuration file
*.* @192.168.10.2:514
On the receiving test-vm2 rsyslog server you need to add the following to /etc/rsyslog.conf;
# Provides UDP syslog reception
# for parameters see http://www.rsyslog.com/doc/imudp.html
module(load="imudp") # needs to be done just once
input(type="imudp" port="514")

$template RemoteLogs,"/var/log/%HOSTNAME%/%PROGRAMNAME%.log"
*.* ?RemoteLogs
& ~
With these modifications, I’m sending all my logs from test-vm1 (192.168.10.1) to test-vm2 (192.168.10.2) using UDP over a data diode. Now we get to some unorthodox ways to use rsyslog for metric streaming.
Streaming Metrics using Zabbix 7
Zabbix version 6.4 added the support for metric streaming which is typically used for data lakes. You can read more about Zabbix Data streaming on their blog post Integrate Zabbix with your data pipelines by configuring real-time metric and event streaming – Zabbix Blog. We can use this to our advantage, as in this Part 1 of the blog post we want to stream metrics from our secure environment, one-way to the less secure environment. To get this to work, we need to take a few steps to achieve our goal.
For the sake of this exercise, we need a few things;
- Test-VM1 on the “secure” side
- Zabbix Server with Database
- Zabbix Agent
- Rsyslog Sender
- Zabbix data streaming and a modified stream receiver to rsyslog interpreter
- Test-VM2 on the “less-secure” side
- Zabbix Server with Database
- Zabbix Agent
- Rsyslog receiver
- Parser from rsyslog with Zabbix Sender
- A Data Diode between test-vm1 and test-vm2 allowing traffic from test-vm1 to test-vm2, but not the other way around.
Configuring data streaming to a log file
We are going to stream metrics from Zabbix Server on test-vm1, using the metrics collected by the agent located on the same server. Configure your Zabbix Server and Agent as usual, no special sauce required here.
Next we want to configure our Zabbix Server to stream metrics, and for this we are going to use a modified version of the example provided in the Zabbix Manual. Create a new connector on the test-vm1, and configure it to stream metrics to a loopback listener http://localhost:8080/v1/history as following;
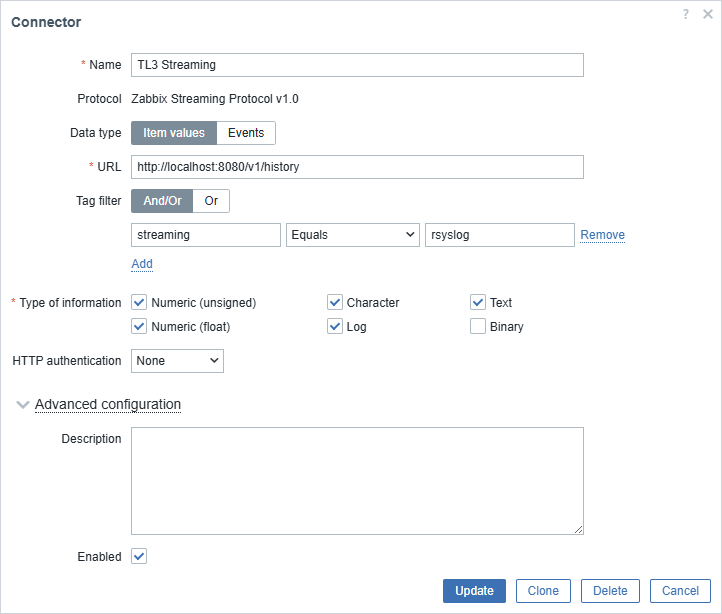
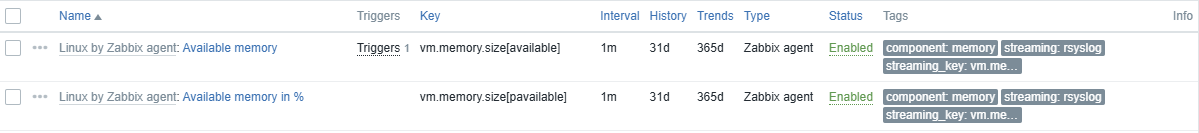
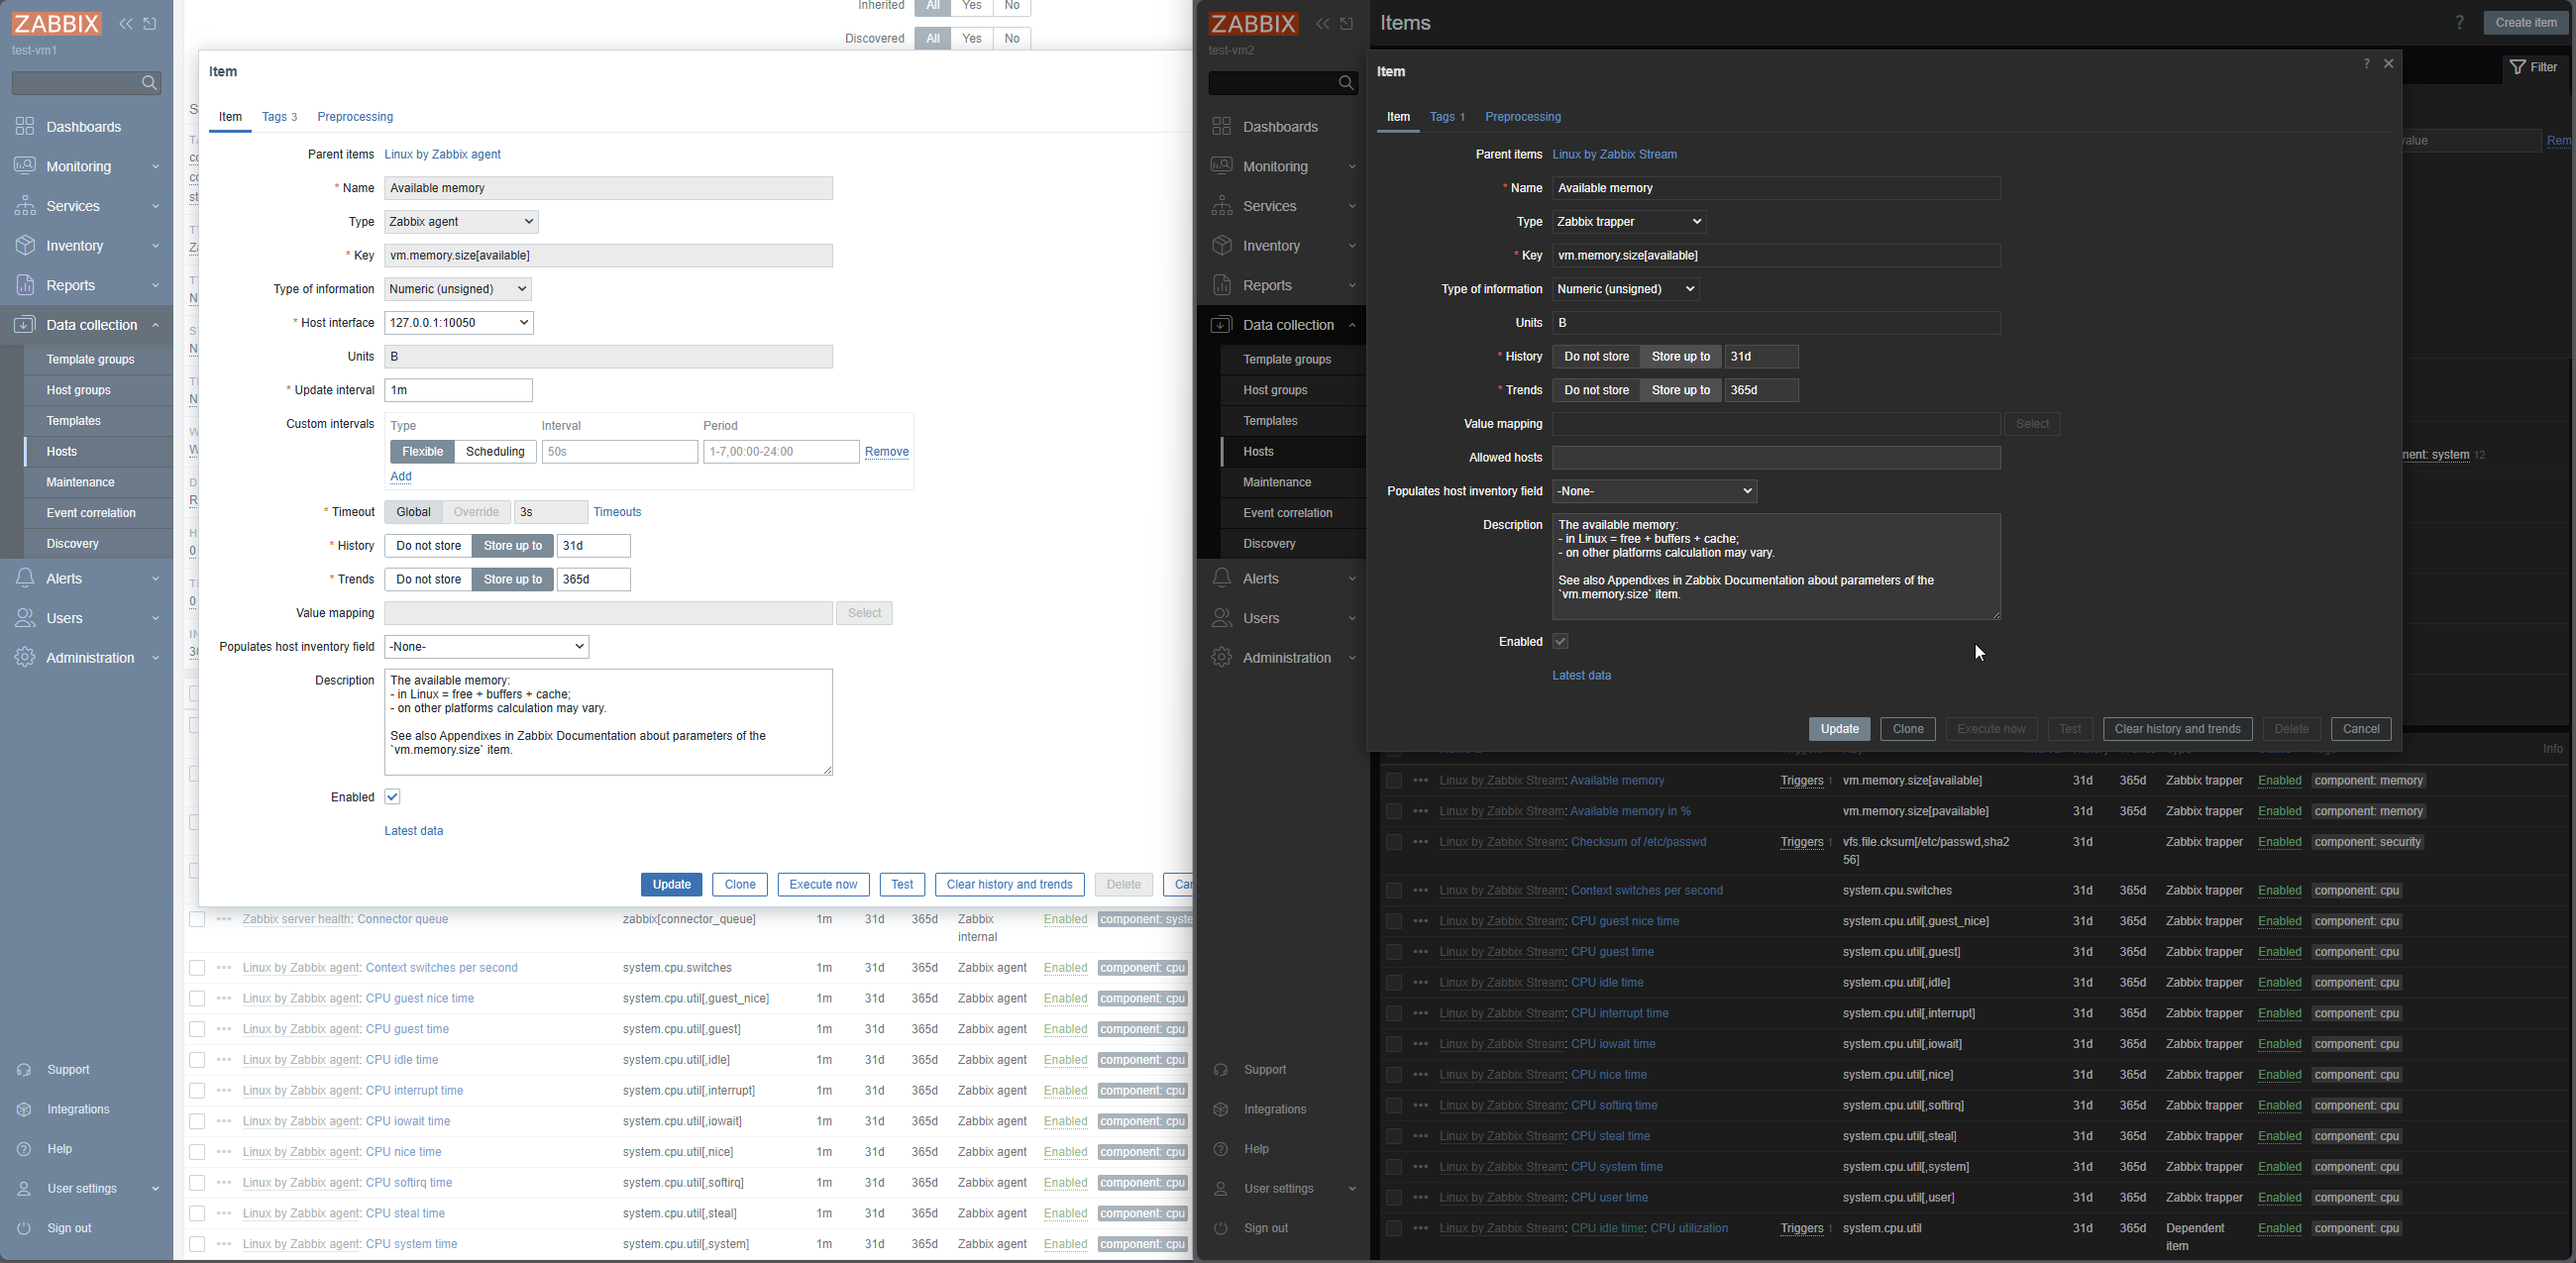
We are going to use two tags to accomplish our goal, first is the tag key streaming with value of rsyslog. This will tell Zabbix which item values we want to send to an external connector. Next we will modify a few items for our metrics streaming, and add a second key value pair to them. In this example, I’ve modified two items, and added the first tag key value pair to indicate they should be streamed, and as a second tag key value I’ve used streaming_key with the value of the item key. This item key is required to specify what item values we are sending. The connector stream contains the item id, but not the item key we want to use. Copy and paste the item key from to the tag value.
What we will end up with is something similar to the following;
2025/02/02 15:23:04 request successful with data: {"host":{"host":"zbx-server-test-vm1","name":"zbx-server-test-vm1"},"groups":["Zabbix servers"],"item_tags":[{"tag":"component","value":"memory"},{"tag":"streaming","value":"rsyslog"},{"tag":"streaming_key","value":"vm.memory.size[pavailable]"}],"itemid":42244,"name":"Available memory in %","clock":1738502584,"ns":283008332,"value":36.261912,"type":0}Experimental connector for data streaming (PoC)
To pipe the date from our connector to a log file, I’m using the Experimental connector for data streaming (PoC) that can be found at Browse Zabbix Tools / Receiver – ZABBIX GIT. But we can’t use it as such, as the experimental tool will write the streaming data to a file. We can’t have that!
To make these changes, I’ve made two modifications to the server.go file.
- Add “log/syslog” to imports on line 27
- Changes to func saveData. Commented out the old “_, err = file.WriteString(string(body))” and added a new sendToSyslog
//_, err = file.WriteString(string(body))
//if err != nil {
//      return fmt.Errorf("failed to write to save file %s", err.Error())
//}

// Send log data to rsyslog server
if err := sendToSyslog(string(body)); err != nil {
	log.Printf("Warning: Failed to send log to syslog: %v", err)
}- Add the new function to server.go file
// sendToSyslog sends logs to a remote rsyslog server
func sendToSyslog(message string) error {
	sysLogger, err := syslog.Dial("udp", "127.0.0.1:514", syslog.LOG_INFO|syslog.LOG_USER, "ZbxStream")
	if err != nil {
			return fmt.Errorf("failed to connect to syslog: %w", err)
	}
	defer sysLogger.Close()

	return sysLogger.Info(message)
}
The modifications will send any received entry by the http listener to syslog as INFO and as the application ZbxStream. Compile the listener and run it. Make sure selinux doesn’t block Zabbix from streaming to the experimental listener on port 8080.
The modified version can be downloaded at; Zabbix-Repository/Zabbix Tools – Receiver to rsyslog at master · Zimeon-/Zabbix-Repository
Received logs to Zabbix Sender
On test-vm2 we can now observe a new log file in /var/log/test-vm1 directory named ZbxStream.log, based on the example configuration made above. The received log entries will look something similar to the following;
Feb  2 16:06:04 test-vm1 ZbxStream[18166]: {"host":{"host":"zbx-server-test-vm1","name":"zbx-server-test-vm1"},"groups":["Zabbix servers"],"item_tags":[{"tag":"component","value":"memory"},{"tag":"streaming","value":"rsyslog"},{"tag":"streaming_key","value":"vm.memory.size[pavailable]"}],"itemid":42244,"name":"Available memory in %","clock":1738505164,"ns":284347550,"value":36.670131,"type":0}
Feb  2 16:07:04 test-vm1 ZbxStream[18166]: {"host":{"host":"zbx-server-test-vm1","name":"zbx-server-test-vm1"},"groups":["Zabbix servers"],"item_tags":[{"tag":"component","value":"memory"},{"tag":"streaming","value":"rsyslog"},{"tag":"streaming_key","value":"vm.memory.size[pavailable]"}],"itemid":42244,"name":"Available memory in %","clock":1738505224,"ns":284416375,"value":36.672553,"type":0}
To get these metrics to the Zabbix Server located on test-vm2, we need to listen to this log file, and on any new entry send the date using Zabbix sender. For this to work, we already have the key components in the message. We have the hostname (host), item as the value of tag streaming_key and the value of the collected item in value.
Based on the Zabbix Sender documentation (here), we need 4 variables;
- z – Zabbix server host (IP address can be used as well)
- s – technical name of monitored host (as registered in Zabbix frontend)
- k – item key
- o – value to send
And for that we match the json from the log file as following;
            host = log_data["host"]["host"]
            item_tags = log_data.get("item_tags", [])
            streaming_key = extract_streaming_key(item_tags)
            value = log_data["value"]
The code for the listener can be downloaded at Zabbix-Repository/Zabbix Tools – rsyslog to zabbix sender at master · Zimeon-/Zabbix-Repository.
The output of the streamer will look something like the following;
Sent to Zabbix: zbx-server-test-vm1, vm.memory.size[pavailable], 36.900222
Sent to Zabbix: zbx-server-test-vm1, vm.memory.size[available], 690057216
Sent to Zabbix: zbx-server-test-vm1, vm.memory.size[pavailable], 37.095084
Sent to Zabbix: zbx-server-test-vm1, vm.memory.size[available], 689885184
Results
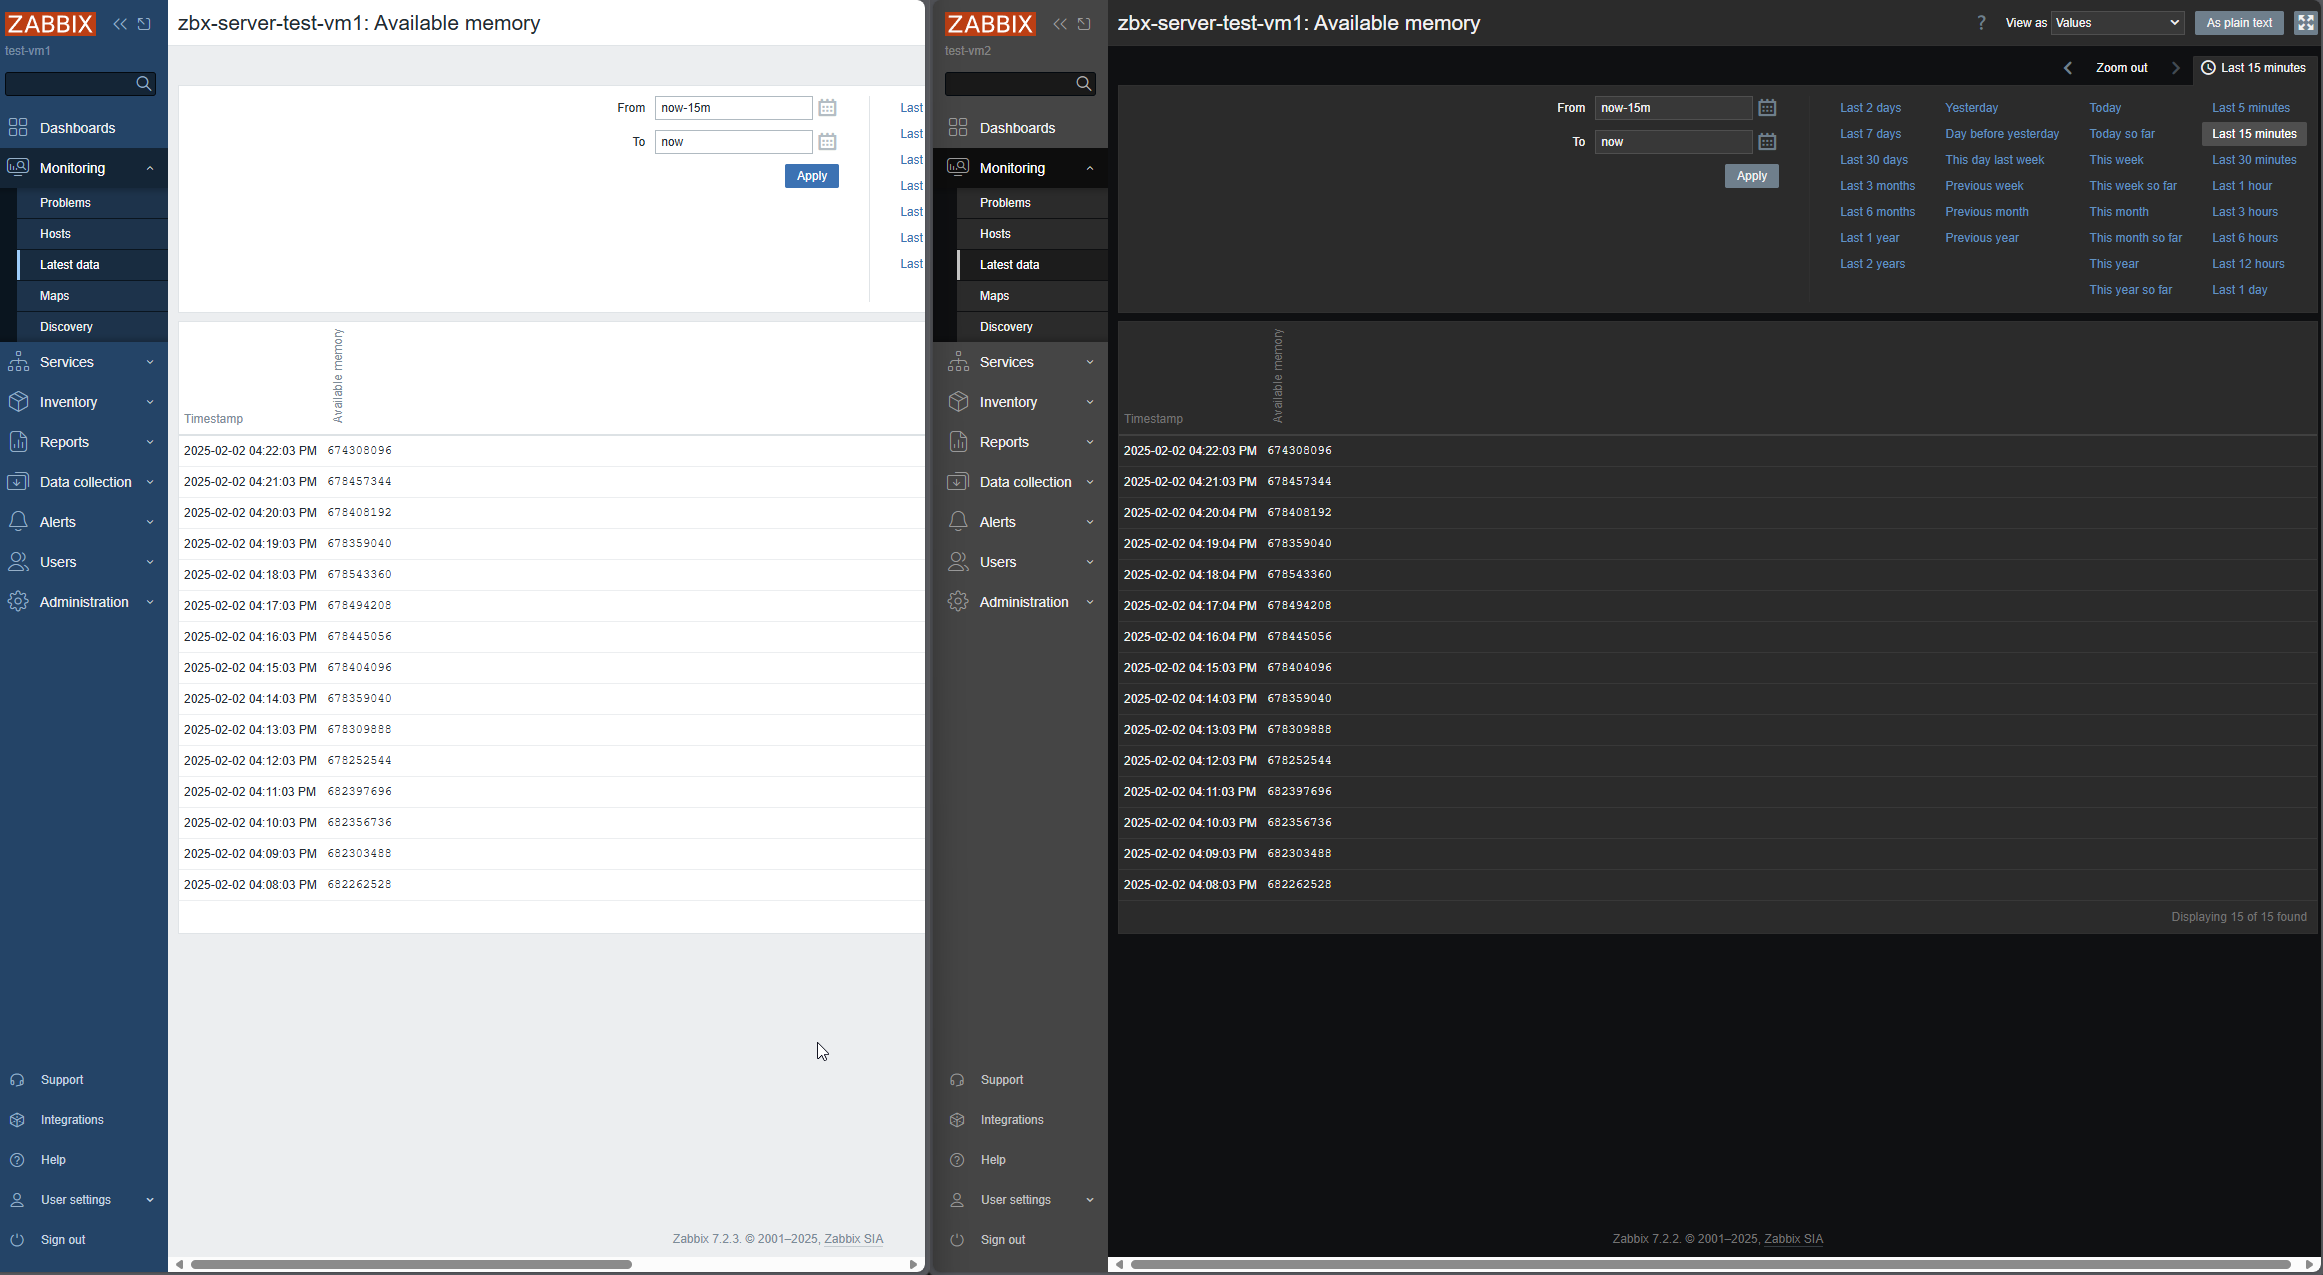
The end result is somewhat of a hack, but we can use the method described above to stream metrics from one Zabbix Server to another, through a data diode. Is there room for improvement? Most definitely. I can see that the python script just can’t keep up large amounts of metrics. On a small scale deployment, the end result will look like the following between test-vm1 and test-vm2.
What are the use cases for this? Well my thoughts so far are that It could be used as a heartbeat between the servers, and if we miss heartbeats then we know something is up with the data stream. I would not send all metrics from one Zabbix server to another, especially from a more secure environment to a lower level. I believe event streaming would be much more of a use case for this. In the next part I’ll continue this endeavour with Zabbix Event streaming.